
Subscribe To

Russell 2000 Technical Analysis
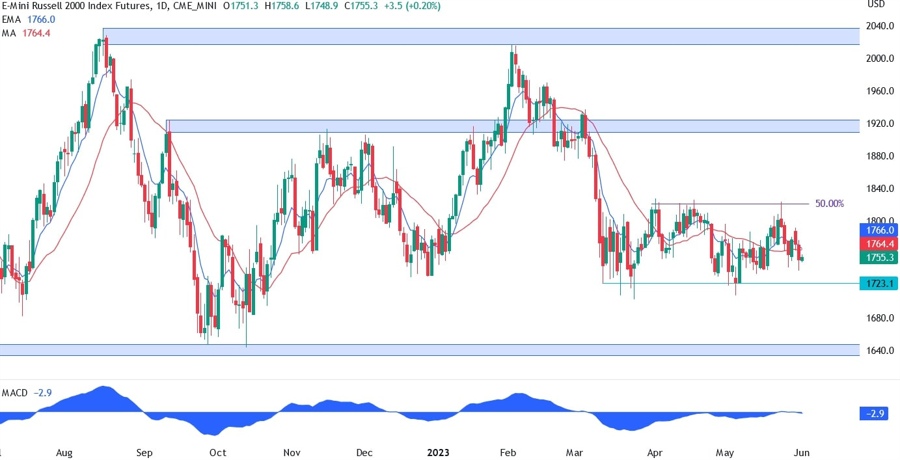
On the daily chart below, we can see that the Russell 2000 is still stuck in the range between the 1723 support and 50% Fibonacci retracement level at 1820 as resistance. These types of markets are tricky for traders as they can get chopped up within the range due to messy price action. The best strategy is usually to just sit out and wait for a clear breakout. But one can also “play the range” by buying at support and selling at resistance, which is something that worked wonders for the Russell...
Read More

Posted: Jun 1 2023, 10:03
Author Name: forexlive
Views: 081362