Subscribe To
S&P 500 Technical Analysis - Key resistance in sight
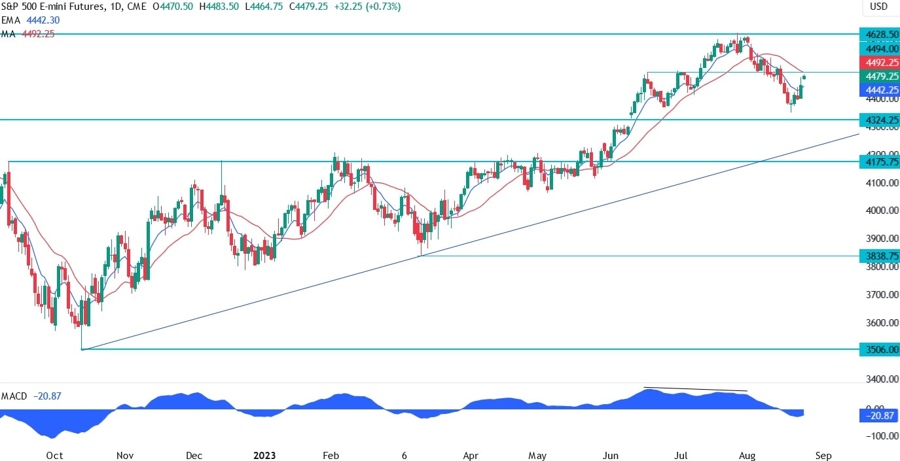
The selloff that started at the beginning of August is starting to show signs of weakness. Although nothing changed fundamentally, the S&P 500 started to rise as the market was just probably overstretched. This looks more like a pullback as the miss in yesterday’s US PMIs doesn’t support the bullish case. S&P 500 Technical Analysis – Daily TimeframeOn the daily chart, we can see that the S&P 500 bounced near a key support at 4324 and rallied all the way back to a previous key level where we can...
Read More
Posted: Aug 24 2023, 08:33
Author Name: forexlive
Views: 0220100